Investing is not just about diversifying between traditional and alternative assets. An investor needs to be able to pick the assets that have the most potential for gain. This series of articles will focus on comparing alternate asset investments relative to each other in order to pick the bigger winner. This edition will focus on the two most popular alternative investments, real estate (specifically single family housing) and gold. The focus will be on the relative price performance of the assets itself. Of course real estate generates cash flow and gold does not. That fact will be put aside for this analysis of the future differential in price of these assets.
The prevailing mood that is driving people to seek alternative investments is a lack of confidence in traditional investments (stocks, bonds, mutual funds). Every day people express to me concern for a market that just does not “feel” right. It just keeps rising no matter what the news. Many articles written by professional traders and wall street insiders for insiders, often joke that bad news is really good news, as the market just keeps going up no matter how weak the market fundamentals.
As an analyst, the things people say are of no use. The only thing that is useful is the history of price action. A person’s actions are their truth regardless of their words or intents. The same thing holds true for investments. The only truth about any investment is its price. The term price is preferred over value. Value is quite subjective. Price is not. Price simply exists. Price is truth. It never lies and it is never wrong. That is why the Elliott Wave Principal is my only analysis tool. The principal is based solely on historical price action. Price is the action of the market, which are the collective actions of people. Truth!
Claim up to $26,000 per W2 Employee
- Billions of dollars in funding available
- Funds are available to U.S. Businesses NOW
- This is not a loan. These tax credits do not need to be repaid
In the course of a normal days work, showing people how they can invest their retirement funds in alternative assets, far and away the two most popular alternative investments are gold and real estate. Applying wave analysis to their relative price histories could be insightful in revealing which investment is likely to have the better price performance over the coming years.
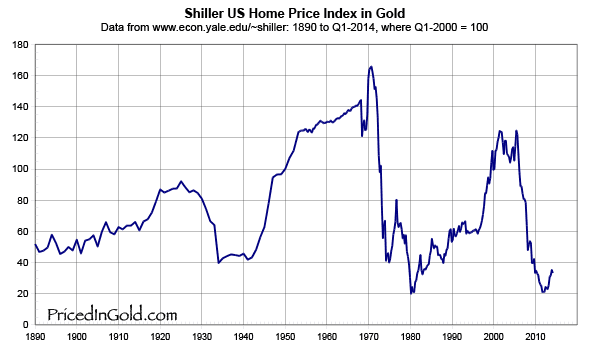
In preparing to do this, a website called www.pricedingold.com looked like it had the data needed for this comparison. The premise is that gold is real money. If you want to know the true price of any particular investment, you should see its price in terms of true money, i.e. gold. In wave analysis, more price history is always better. After consulting the chart of housing priced in gold with an Elliott Wave perspective, it was quite apparent that housing was likely to be the better investment for decades to come. Likely two or more. It is important to note that time is not a part of Elliott Wave analysis but time cycles do appear and they tend to be in line with Fibonacci ratios. As you can see from the chart, from 1890 to about 1970 housing was the better investment as it went from buying 50 mg of gold to buying over 160 mg of gold. This trend took about 80 years. From slightly after 1970 to 2012, that trend reversed dramatically. In 2012 housing purchased less gold, on a relative basis, than it had in 120 years. Note that the time it took to fall was approximately half the time that it took to reach its all time high. There is a certain proportionality to the timing. In this case about 2 to 1. Bull markets are slow and plodding. Bear markets move like lightning by comparison.
When you look at the chart you can see that, on a relative basis, there is almost no more room for gold to beat real estate in price. Does anyone really believe that housing will purchase zero gold? No, this picture of price is showing the future trend. Trends always end. The problem is that most people cannot identify a change in trend until it is quite advanced, usually it is half over by the time the herd clues into it. To make things worse, when a trend has already ended is when people most fervently believe it will continue. Can you remember 1999 and the dot com implosion, or perhaps 2005 right before the housing free fall?
From the chart, it is apparent that gold will take a back seat to real estate in price. When you combine this perspective with the fact that real estate generates a periodic cash flow, real estate looks to clearly be the better choice. At this time, it is very important to note that the price of both of these investments could be going down at the same time and still see a rise in housing price relative to gold. Remember that this is a relative analysis of two asset classes and not a determination of the ultimate direction of either of these investments. I expect house pricing to outperform gold by over 300% while this new trend that began in 2012 is in effect. In terms of wave analysis, the 2012 bottom in this chart is likely to hold. I would expect a move up to at least 125 on the Y axis before the relative performance of housing to gold makes any significant change.


